Wilhelmshaven from 1881 to today
Wilhelmshaven from 1881 to today
Climate - what is it?
Climate is the statistical evaluation of weather data collected through standardised measurements. In order to depict climate trends, climate data is analysed over a period of 30 years.
Monthly temperature data since 1881
The following table shows the average monthly temperatures (in °C) measured at a height of 2 metres. Each value was formed from the averaged monthly data of 30 years, with the exception of the columns on the right-hand side of the table, which are successively updated.
(Status of the table: January 2025)

Information on data gaps
Due to the two world wars and the shutdown of the original DWD station Wilhelmshaven in 1998, there were data gaps that could be eliminated by using data from the two DWD stations Jever and Wangerland-Hooksiel. The absences during and after the wars were supplemented by data from the DWD station Jever and from February 1999 data from the DWD station Wangerland-Hooksiel were used. Of the stations mentioned, only Wangerland-Hooksiel is currently still operated by the DWD (German Weather Service).
Like the former DWD station Wilhelmshaven, the DWD station Wangerland-Hooksiel is located directly on the coastline and only a few kilometres (6 - 7 km) to the northwest. The data should hardly differ due to the very similar location.
The forest location of the DWD station Upjever largely compensates for any deviations from the station further inland. Like the sea, the tree population provides a certain damping/equalisation of the measured values in summer and winter (cooler in summer and warmer in winter).
Extreme rise in temperature
The representation of the changes in mean annual temperatures (last line of the table above) illustrates the steep rise since the 1960s and thus the above-average increase in temperature to date. The slight flattening of the curve in the current, still incomplete interval could be an indication of the initial success of climate protection measures.
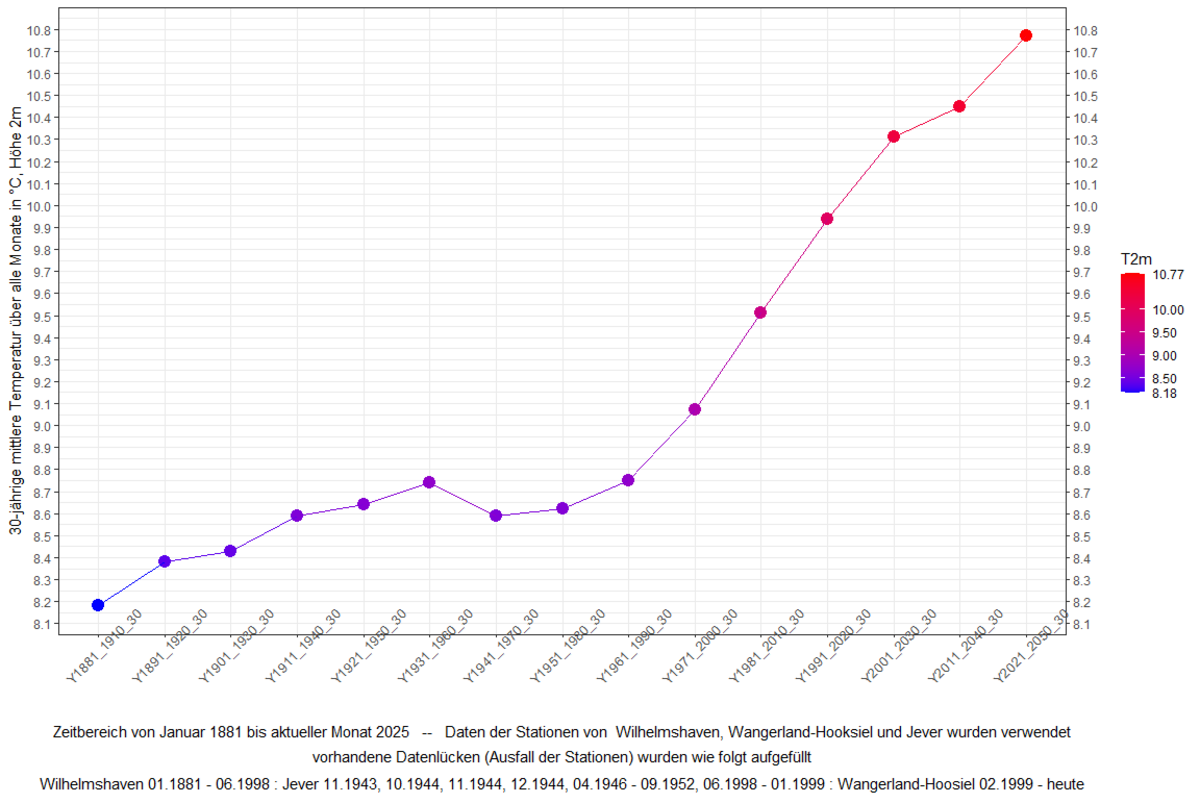
In the following animated graphic or video, it is possible to view the development of the average monthly temperature per year since 2001 up to the present day.
The heading shows the respective year of the displayed state, the points of the graph are labelled with the end numbers of the respective year.
The points (values) of the 30-year climate periods before 2001 no longer change, only the last climate period from 2001-2030 changes.
A specific year can be selected with the left mouse button. To do this, simply click on the grey strip below the graph with the left mouse button. It is also possible to move the now visible point on the strip forwards and backwards as a slider.
Pressing the play symbol below the graphic allows the data sequence to run continuously from 2001 to 2024.
Reference period (climatological reference period)
The current reference period is 1971-2000 (formerly 1961-1990 or 1951-1980) and has not been taken into account in the table or the graph above. Further information can be found on the website of the German Weather Service:
www.dwd.de/DE/service/lexikon/Functions/glossar.html?lv2=101334&lv3=101456
Visualisation of the annual mean temperature according to Ed Hawkins
The colour coding of a "warming strip" is used to highlight the temperature change.
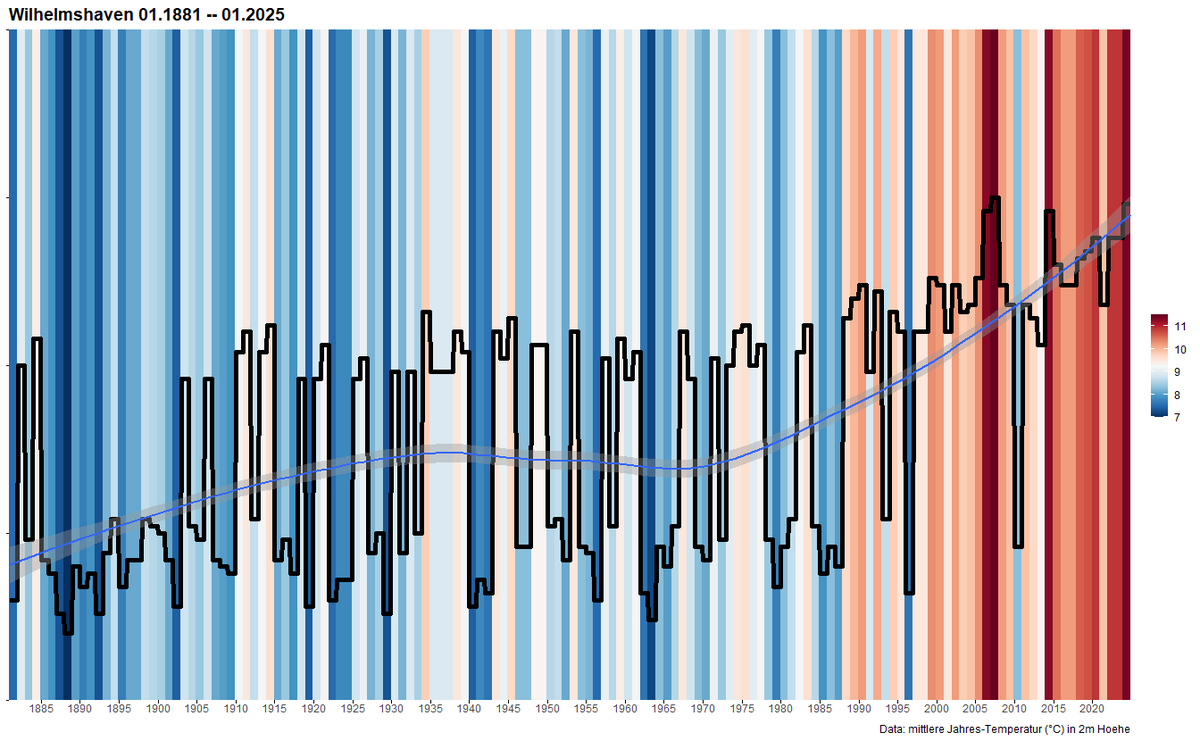
Graphic: warming stripe according to Ed Hawkins(www.met.reading.ac.uk/~ed/home/index.php)
The weekly newspaper "Die Zeit" offers the opportunity to create your own "warming stripe" for a selected location in Germany at its website www.zeit.de/wissen/umwelt/2019-12/klimawandel-globale-erwaermung-warming-stripes-wohnort.
The Mellumrat e.V. published a first article on the available temperature data with a focus on the summer month of August and the winter month of January:
Hillmann/Freund (2020): Climatic changes on the coast - data from the Wilhelmshaven, Jever and Hooksiel weather station
[Der Mellumrat e.V. "Natur und Umweltschutz", 19/1, pp. 26-29]
Further articles on the climatic changes in our coastal area will follow, focussing on wind conditions, rainfall and heat waves. Articles are also planned on their effects on the local flora and fauna.